Debugging is the task to identify and remove errors from software applications, and is more than just printing out values in your code. This post describes how to efficiently debug Node.js programs using the latest Google Chrome DevTools. A lot of developers use console.log in order to debug their application. but why? The answer is easy: It’s inconvenient to use the debugger if you haven’t set up your environment correctly.
Why console.log is not the best option?
Using console.log to debug your code generally dives you into an infinite loop of “stopping your app, adding a console.log, and start your app again” operations. Besides slowing down the development of your app, it also makes your writing dirty and creates unnecessary code. Finally, trying to log out variables alongside with the noise of other potential logging operations, may make debugging difficult when attempting to find the values you are debugging.
Debugging tools
Debugging tools provide you with a few important functionalities that console.log isn’t able to provide. In particular they let you pause the execution of your application at specific points in the code, and inspect and modify the values of the variables while the program is still running.
Built-in debugger
Node.js ships with a built-in debugging facility. If you start your application on the command line with node debug index.js where index.js is the starting point of your application then it is started in debug mode. This command has two effects: You start an interactive debugging shell and you open a TCP connection on port 5858 where you can connect a remote debugger with your application. The CLI debugger is the most uncomfortable solution directly after debugging with console.log. But you have a set of commands that make it possible to navigate within your application at run time.
$ node debug index.js
More Advanced Debugging
Chrome and Node.js share with V8 the same JavaScript engine, so it should be possible to use the same tools for debugging and profiling your applications. For older versions of Node.js there was a tool named node-inspector which connected the V8 engine of node with the Chrome Developer Tools. Unfortunately it doesn’t work for current Node.js versions. But this is not a problem anymore, because in May 2016 the –inspect flag landed in Node.js and with it a much better debugging support. In contrast to node-inspector you don’t have to install any additional module in order to get the –inspect flag working. You just have to start your application with this flag.
$ node--inspect index.js
As soon as you start your application, Node.js provides you with a URL which you have to copy to the address field of your Chrome browser. Your browser then connects to your Node.js instance and lets you debug and profile your application. This includes setting breakpoints and watch expressions or capturing memory snapshots of your application.

IDE Debugging (VS Code)
Most of the current IDEs support debugging of Node.js applications such as WebStorm, Eclipse or Visual Studio Code. It’s surprisingly easy to get your debugging environment started in Visual Studio Code, which is by the way just another Node.js application. You just have to hit the debug button on the left side of the window and select the environment you want to debug (Node.js). Visual Studio Code then creates the launch configuration for you and saves it to the .vscode/launch.json file in the root folder of your application. Depending on the starting point of your application you have to make an adjustment here. VSCode expects your application to start at app.js. If you name the starting point differently, just go to launch.json and change the value of the program key. After this is done, you can launch your debugger and have a look at your application.
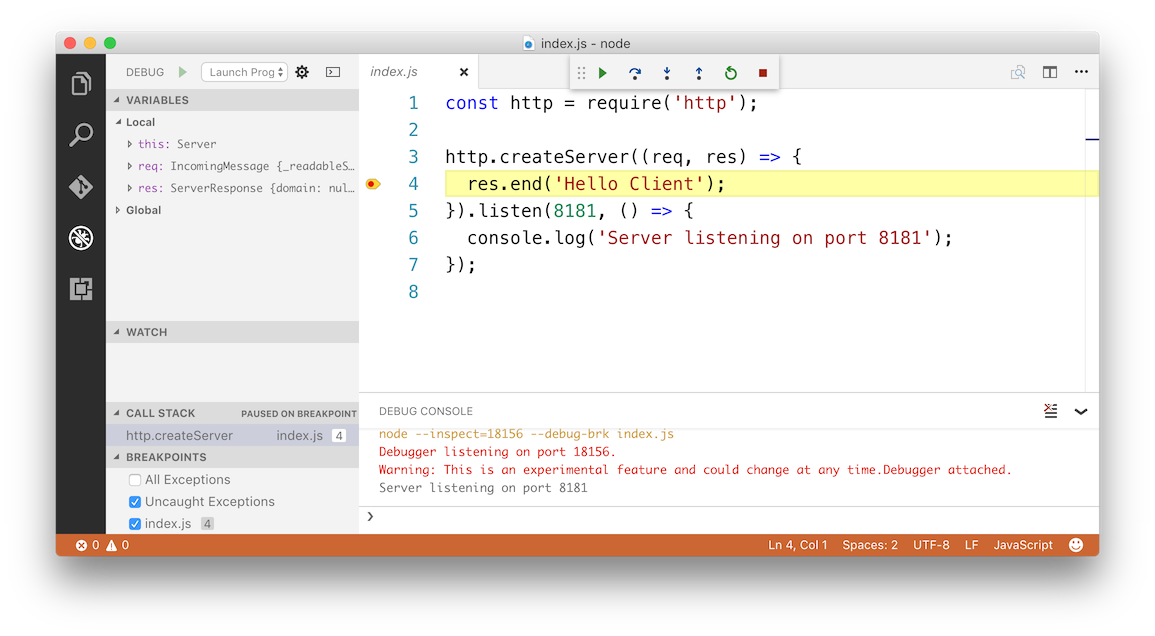
For this example a simple web server was created. In order to debug this application, you have to set a breakpoint (by clicking on the left of the line number), launch the debugger and go to the server URL in your local browser. The application then automatically stops at your breakpoint and you can start stepping through your code.
As you see, there’s no more need for console.log statements to debug your application code. Just start the debugger of your choice and have a comfortable interface to have a look at your code at run time.
This blogpost was Originally written for Codeship authored by me you can find it here on codeship’s blog